Research
Paid press release. BSCN does not endorse this content.
(Advertisement)


Bitcoin Leads Market Shakeout as Bulls Defend Long-Term Support; Ethereum and Solana Follow Suit

Bitcoin rebounds from key long-term support after a steep sell-off, while Ethereum and Solana mirror BTC’s recent market shakeout.
Miracle Nwokwu
February 7, 2026

(Advertisement)
Table of Contents
Bitcoin entered 2026 on a relatively constructive note, briefly stabilising after the year-end volatility. However, that optimism faded quickly over the past few weeks as BTC experienced a sharp sell-off, driving price aggressively toward the 200-week moving average around the $58,000–$59,000 region.
Historically, this zone has played a pivotal role across multiple market cycles, frequently acting as a long-term bear market floor or accumulation area. Notably, the reaction this time has been decisive. Bitcoin rebounded swiftly from that level, signalling strong dip-buying interest and suggesting that long-term participants remain active despite heightened short-term uncertainty.
This sudden drawdown in Bitcoin has reverberated across the broader crypto market. Major altcoins, including Ethereum and Solana, have mirrored BTC’s weakness, with sharper percentage declines reflecting their higher beta. Over the past 20 days, correlations have tightened, reinforcing Bitcoin’s role as the primary driver of market direction.
Bitcoin (BTC): Key Long-Term Support Tested
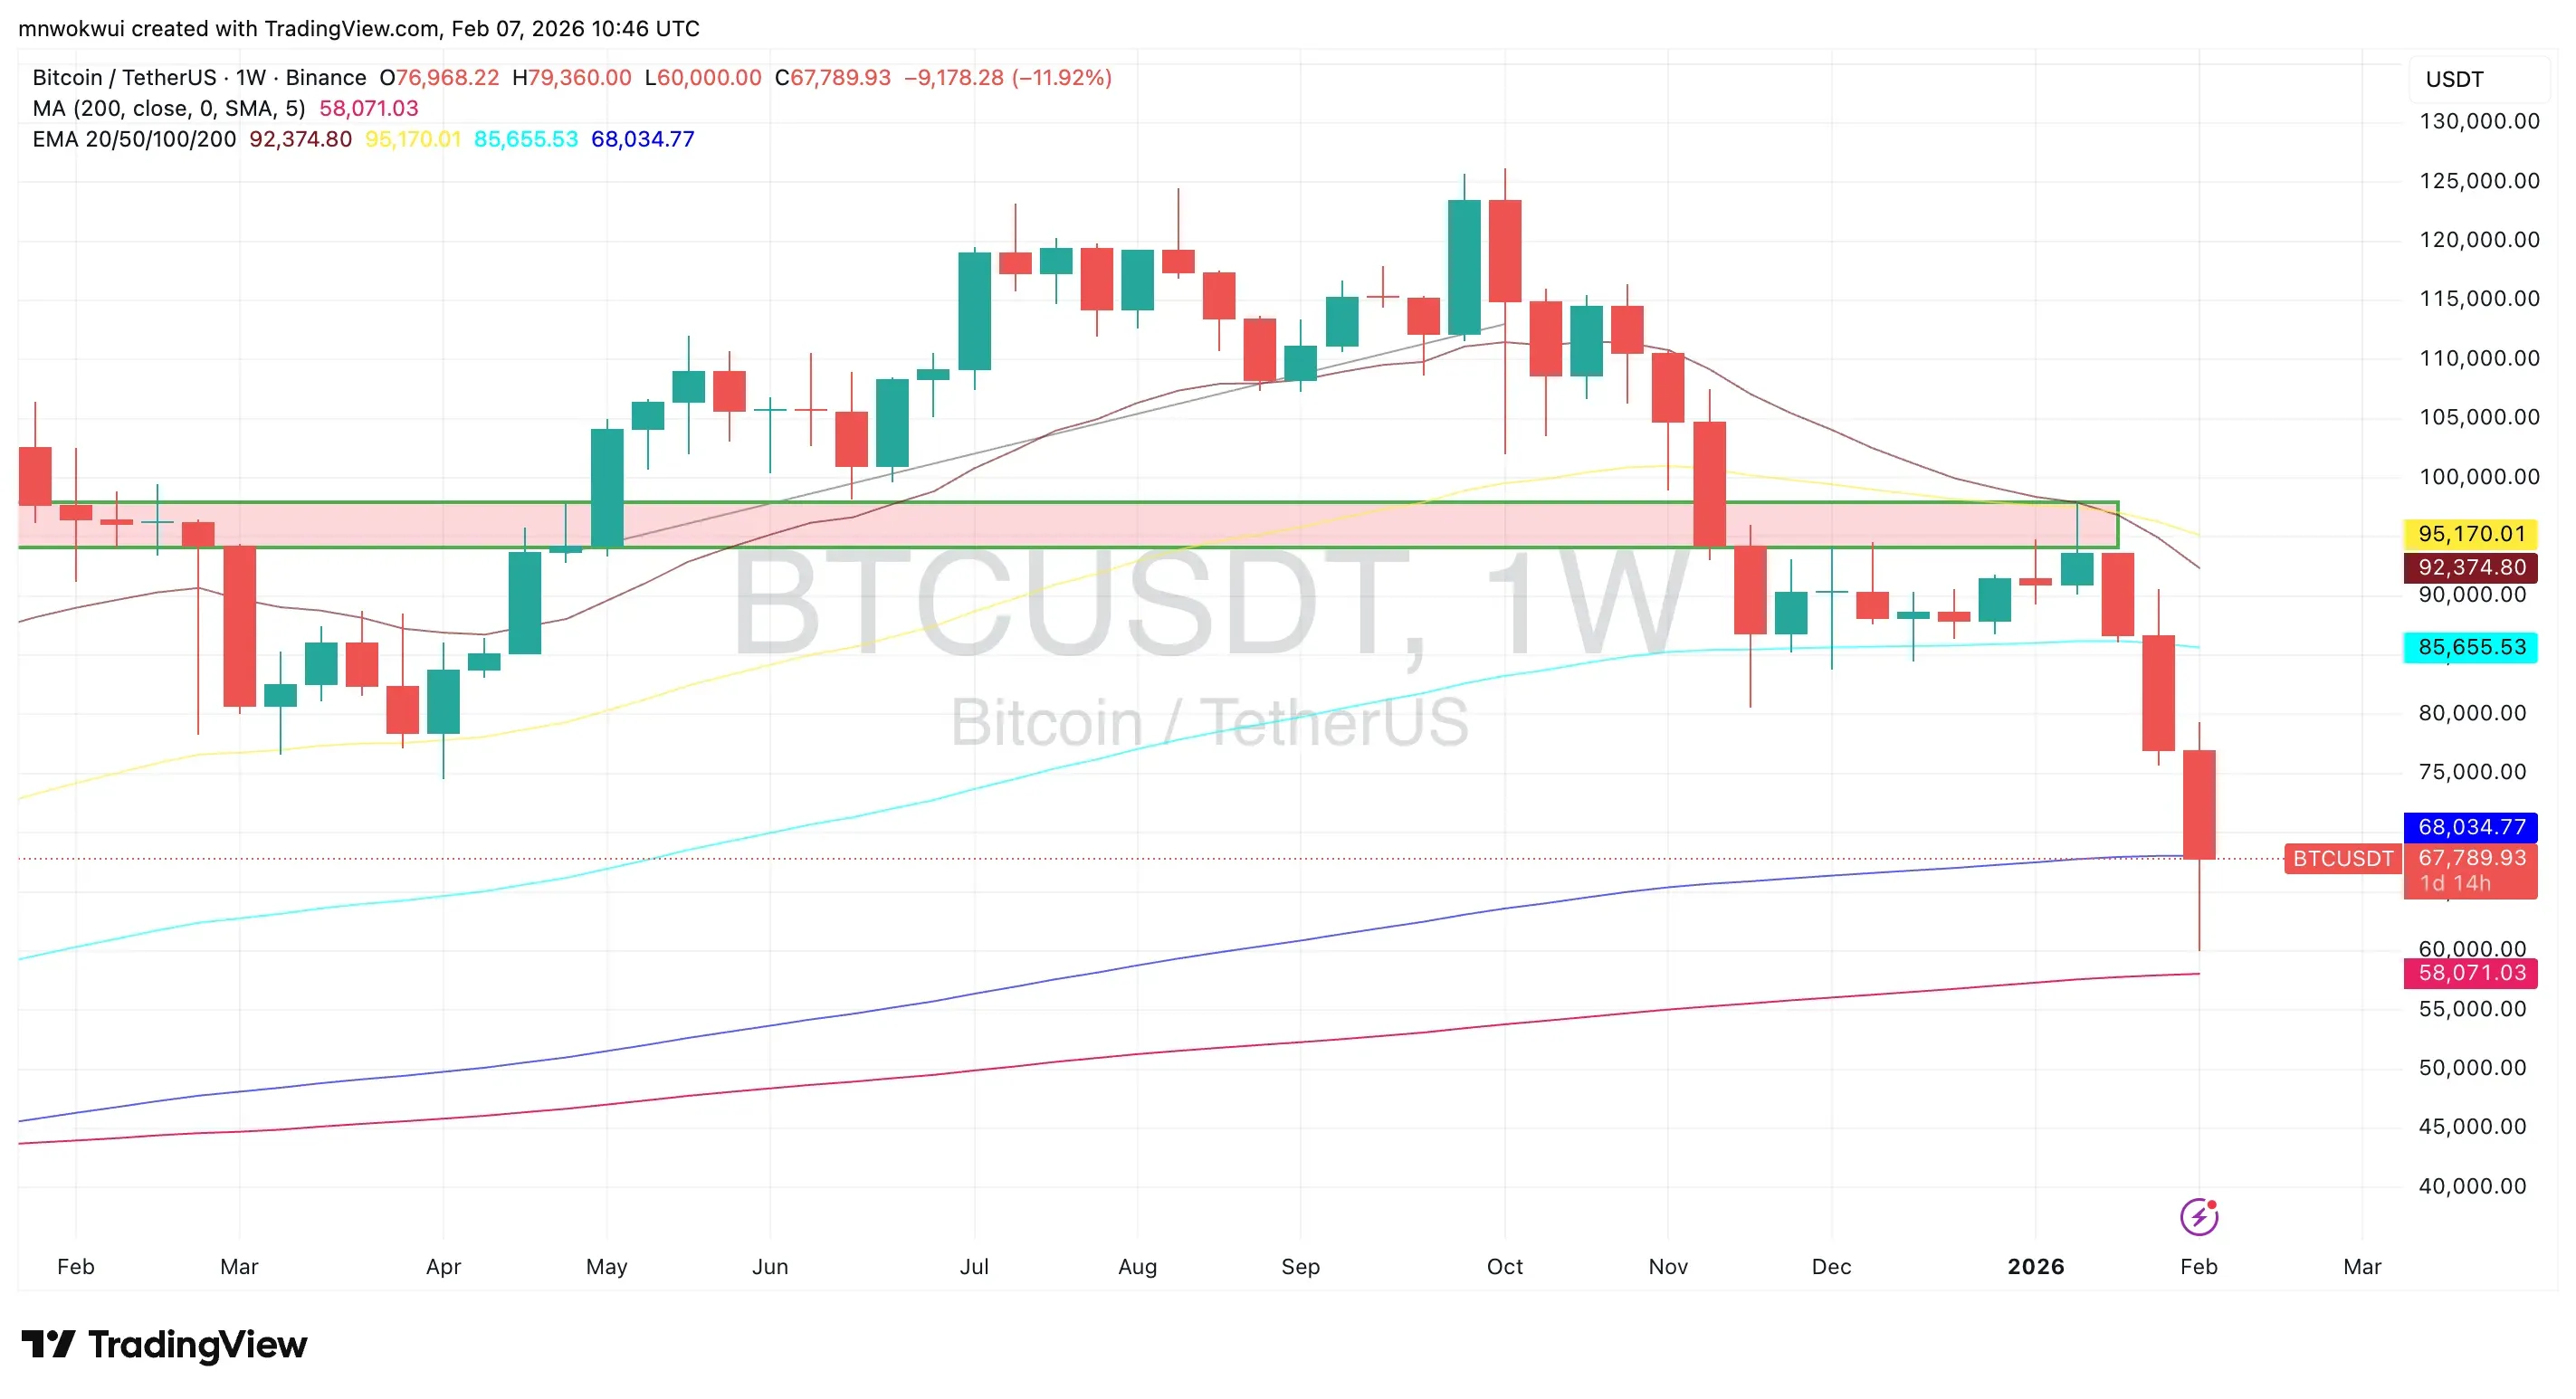
On the weekly chart, Bitcoin’s recent decline saw price slice through multiple medium-term supports before tagging the 200-week moving average. This level, currently sitting just below $60,000, coincides with a zone that has historically marked cycle lows in 2018 and 2022. The swift rebound from this area suggests aggressive demand absorption, with buyers stepping in before a deeper breakdown could materialise.
From a bullish perspective, holding above the 200-week MA keeps Bitcoin’s broader market structure intact. If BTC can consolidate above $65,000–$68,000 in the coming sessions, the move may be interpreted as a classic liquidity sweep rather than the start of a prolonged downtrend. A reclaim of the 100-week and 50-week moving averages would further strengthen the case for a medium-term recovery toward the $75,000–$80,000 region.
On the bearish side, the damage to structure is not negligible. Bitcoin remains below several key exponential moving averages, and momentum over the past 20 days has been decisively negative. Failure to build acceptance above $68,000 could expose the market to renewed selling pressure. A weekly close below the 200-week MA would be a significant technical breakdown, potentially opening the door to a deeper retracement toward the low-$50,000s.
Ethereum (ETH): Breakdown Accelerates Selling Pressure
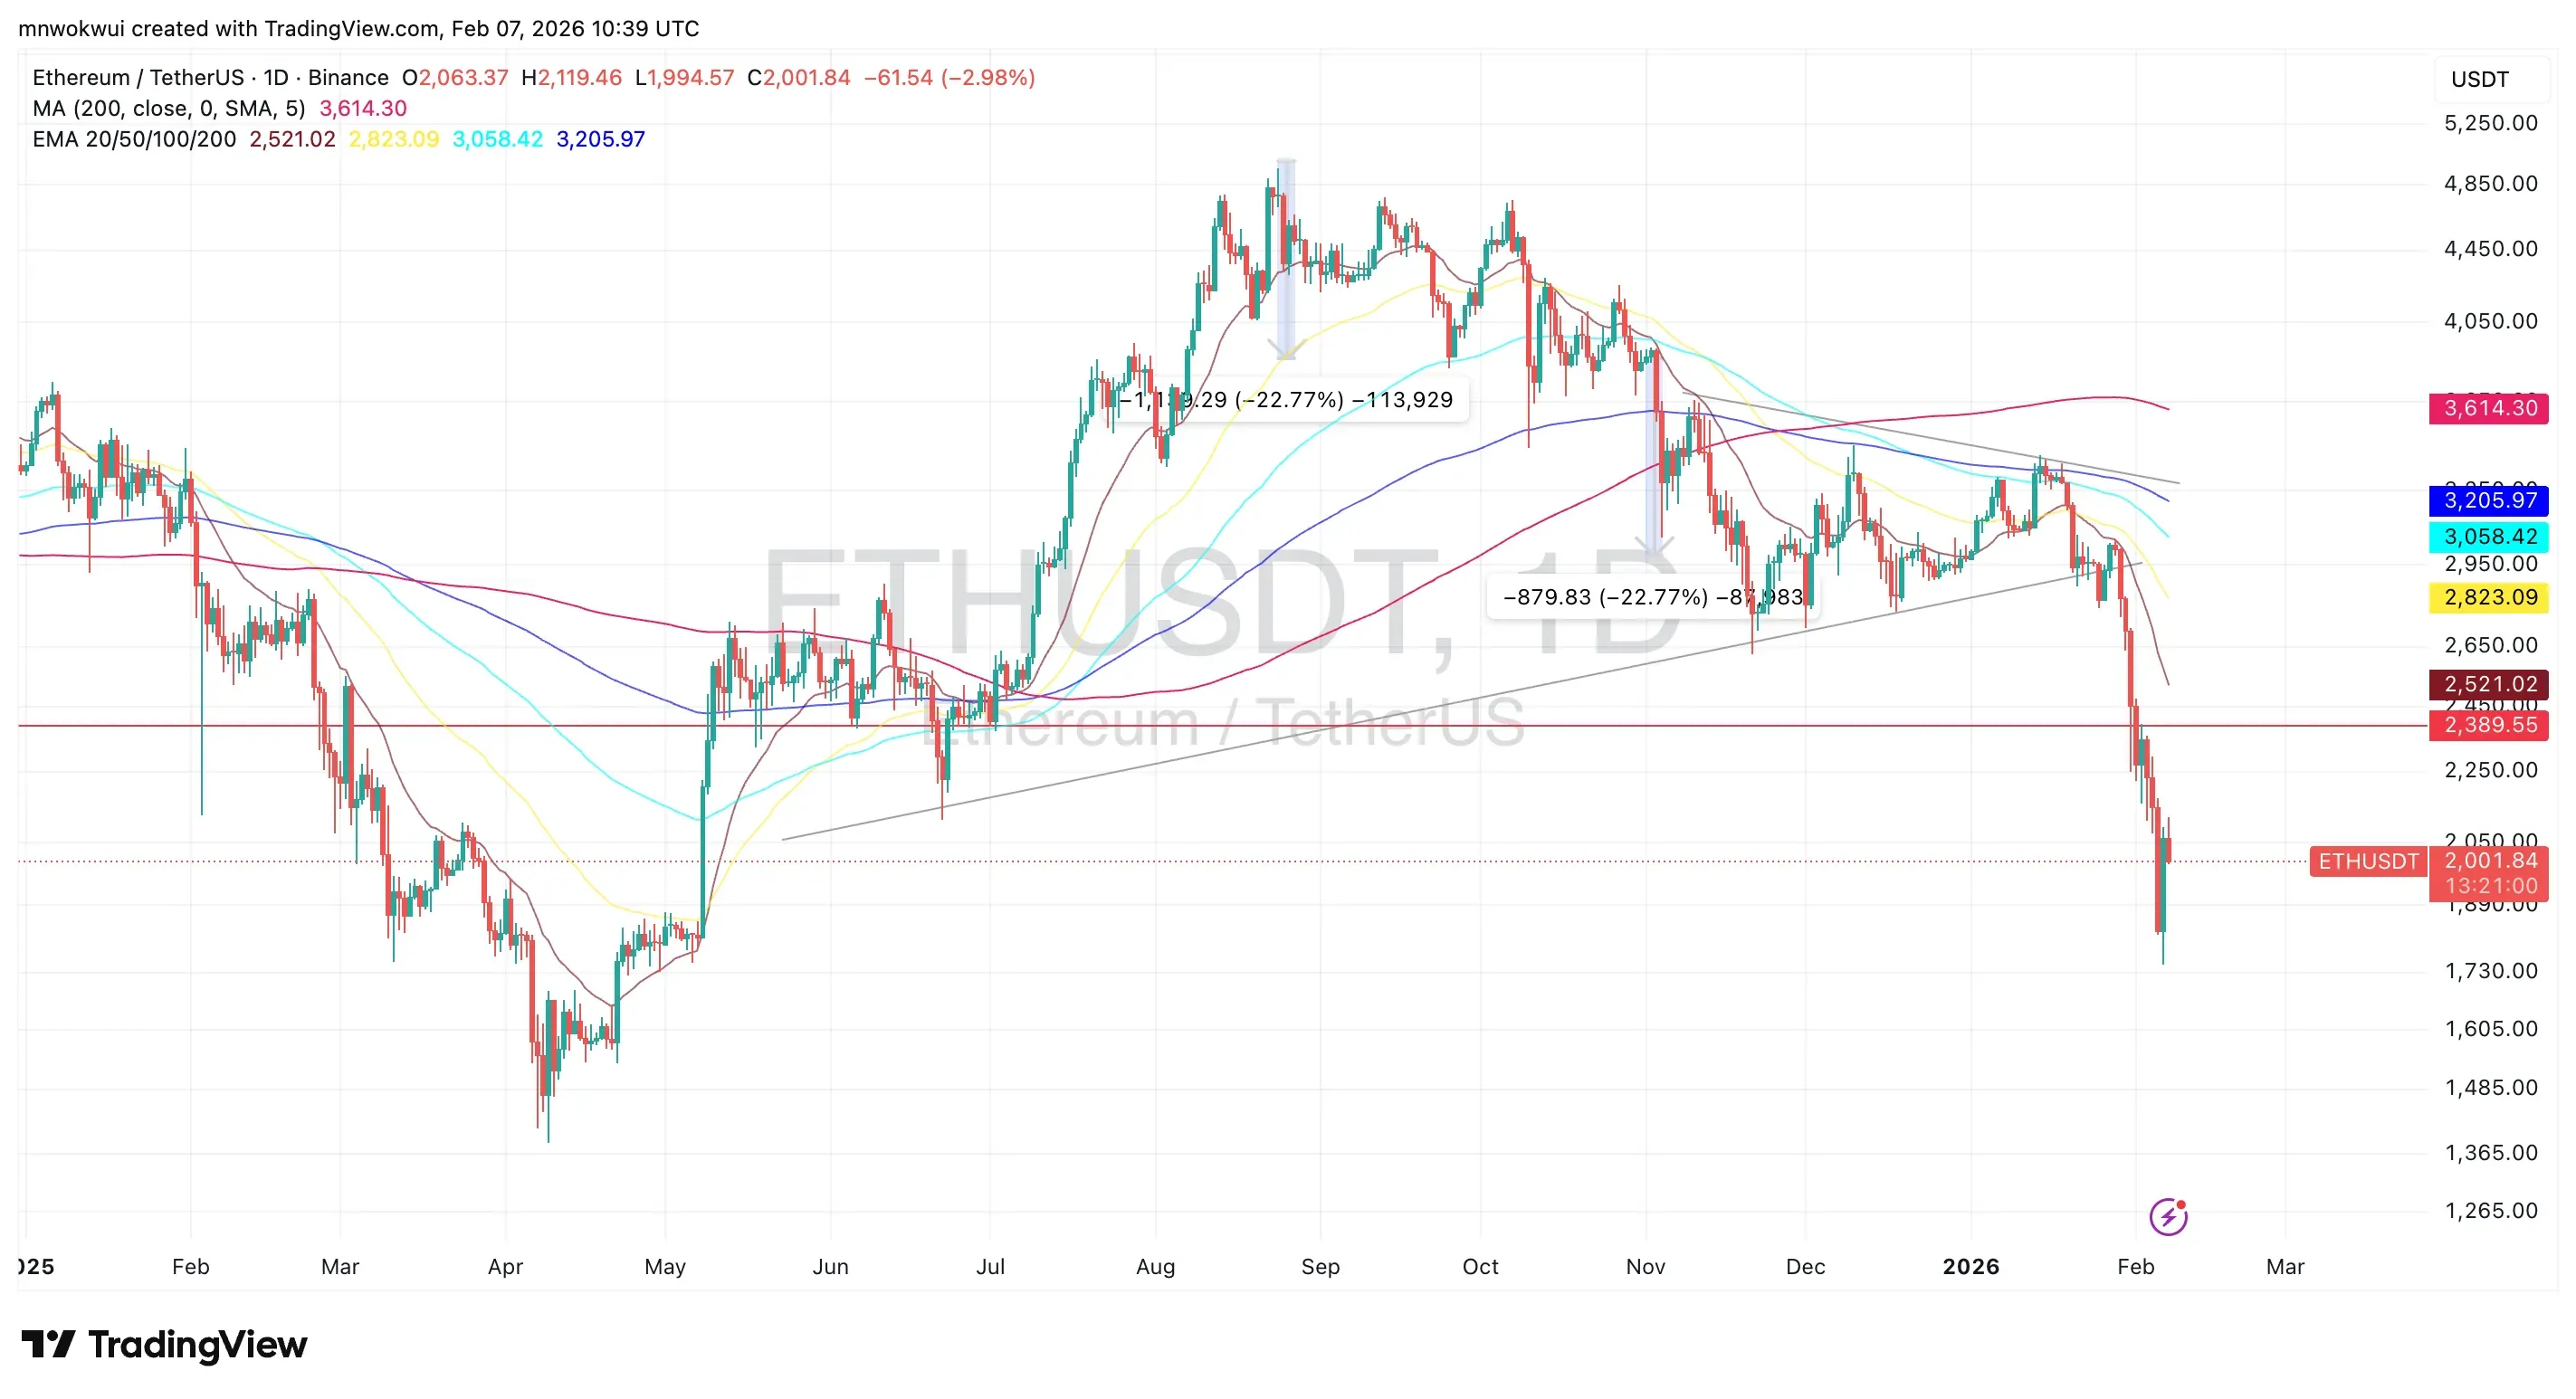
Ethereum has been particularly sensitive to Bitcoin’s downturn. Over the past 20 days, ETH has experienced a steep decline, breaking below multiple moving averages and losing its prior consolidation structure. The recent sell-off pushed price sharply lower, with ETH trading well beneath its 200-day moving average, reflecting a clear shift in medium-term sentiment.
Bullishly, Ethereum is approaching historically reactive demand zones, where prior accumulation occurred. The speed of the sell-off increases the likelihood of a technical relief bounce, especially if Bitcoin continues to stabilise above long-term support. A recovery back above the $2,200–$2,300 range would be the first sign that sellers are losing control, potentially setting the stage for a broader mean reversion move.
However, the bearish case remains compelling. Ethereum’s structure over the last three weeks shows lower highs and lower lows, with moving averages now acting as overhead resistance rather than support. If ETH fails to reclaim the $2,300 level, downside risk persists toward deeper support areas last seen during previous market stress periods. Until buyers demonstrate sustained follow-through, rallies may continue to be sold into.
Solana (SOL): High Beta, Higher Volatility
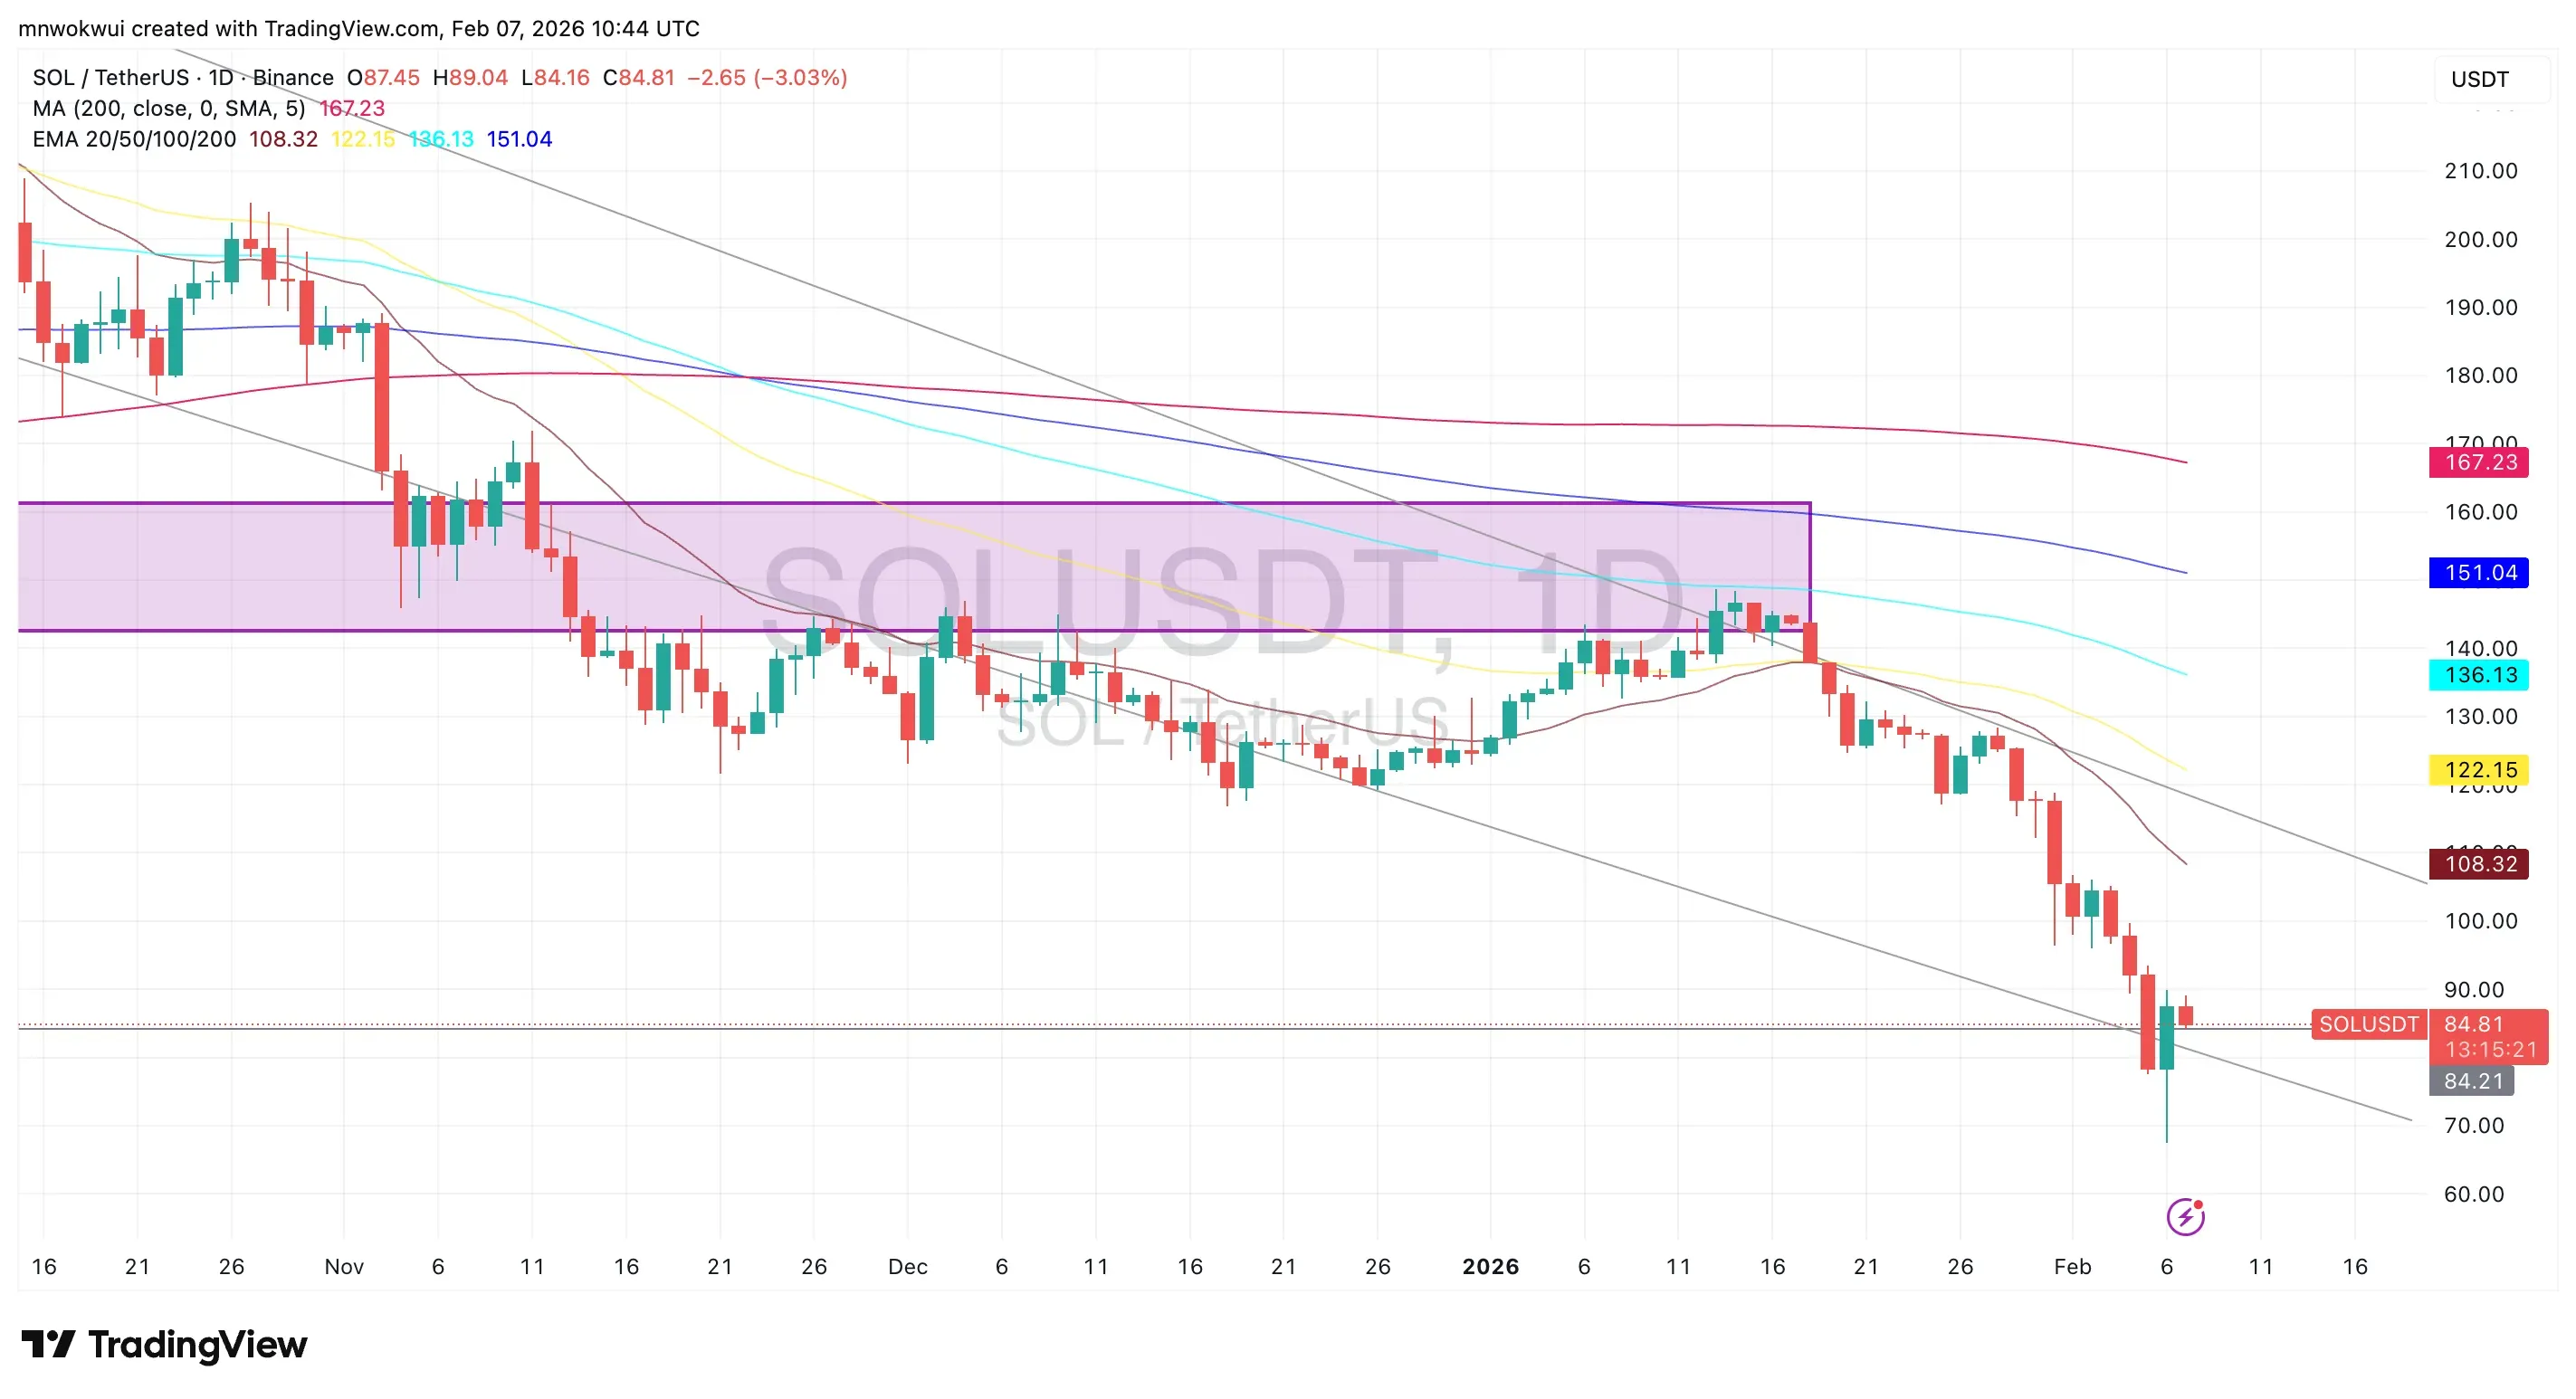
Solana has once again highlighted its high-beta nature during periods of market stress. Over the past 20 days, SOL has underperformed both Bitcoin and Ethereum, breaking decisively below key horizontal support zones. The recent drop accelerated as price lost the mid-range consolidation area, leading to a sharp extension to the downside.
From a bullish standpoint, Solana is now trading near a region where buyers have historically stepped in aggressively. The long lower wicks seen on recent candles suggest some level of demand absorption. If broader market conditions stabilise, SOL could stage a short-term rebound toward former support, now resistance, in the $100–$110 range.
Conversely, the bearish structure remains dominant. Solana continues to trade below its major moving averages, all of which are sloping downward. Without a clear reclaim of these levels, any bounce risks being corrective rather than trend-reversing. A failure to hold current levels could expose SOL to further downside as market participants continue to de-risk.
Final Thoughts…
Bitcoin's test of the 200-week MA represents a moment of truth for the broader ecosystem. The sharp bounce suggests that long-term holders and institutional players see value at these levels, but whether this marks a definitive bottom or merely a pause in a larger downtrend remains to be seen.
For the likes of Ethereum and Solana, the outlook appears more challenging in the near term. Both have broken key support levels and face significant overhead resistance. Any sustainable recovery in these assets will likely require Bitcoin to first establish a firm bottom and begin trending higher.
As always in crypto markets, volatility remains elevated, and risk management is important. The current technical setup suggests significant uncertainty, and traders should be prepared for continued whipsaw price action as markets search for equilibrium.


Disclaimer
Disclaimer: The views expressed in this article do not necessarily represent the views of BSCN. The information provided in this article is for educational and entertainment purposes only and should not be construed as investment advice, or advice of any kind. BSCN assumes no responsibility for any investment decisions made based on the information provided in this article. If you believe that the article should be amended, please reach out to the BSCN team by emailing [email protected].
Author
 Miracle Nwokwu
Miracle holds undergraduate degrees in French and Marketing Analytics and has been researching cryptocurrency and blockchain technology since 2016. He specializes in technical analysis and on-chain analytics, and has taught formal technical analysis courses. His written work has been featured across multiple crypto publications including The Capital, CryptoTVPlus, and Bitville, in addition to BSCN.
(Advertisement)
Latest News
5h : 27m ago

Bitcoin Leads Market Shakeout as Bulls Defend Long-Term Support; Ethereum and Solana Follow Suit
February 6, 2026

CZ Is Working With Governments to Put National Currencies On-Chain
February 6, 2026

Why Is Vitalik Buterin Selling ETH? $13M+ Dumped in 4 Days
February 6, 2026

What Is Warden Protocol? The AI Wallet That Trades for You
February 6, 2026

CZ's Favorite Perp DEX: Aster Explained
February 6, 2026
How Has Valour’s Pi Network ETP Performed So Far?
February 6, 2026

PancakeSwap Cuts Token Supply and Hits $3.5 Trillion Volume
February 6, 2026

How Low Can ETH Go From Here?
(Advertisement)

Crypto Project & Token Reviews
Project & Token Reviews
Comprehensive reviews of crypto's most interesting projects and assets
Learn about the hottest projects & tokens